The Ocean of Data
Our life is immersed in data, we swim in them. We may not pay attention, but we constantly check key performance indicators and use them to support our decisions.
The alarm next to our bed is measuring time and helping us to decide if it’s time to wake up or to turn over and fall into another dream. We check the outside temperature and decide which jacket to wear, we click on weather forecast apps and understand if it might be a good idea or not to carry the umbrella with us. The oven tells us the temperature we are cooking our cake, the fridge how cool is our white wine and I could go on and on, but the word counter of my laptop warns me it’s better to stop here with examples.
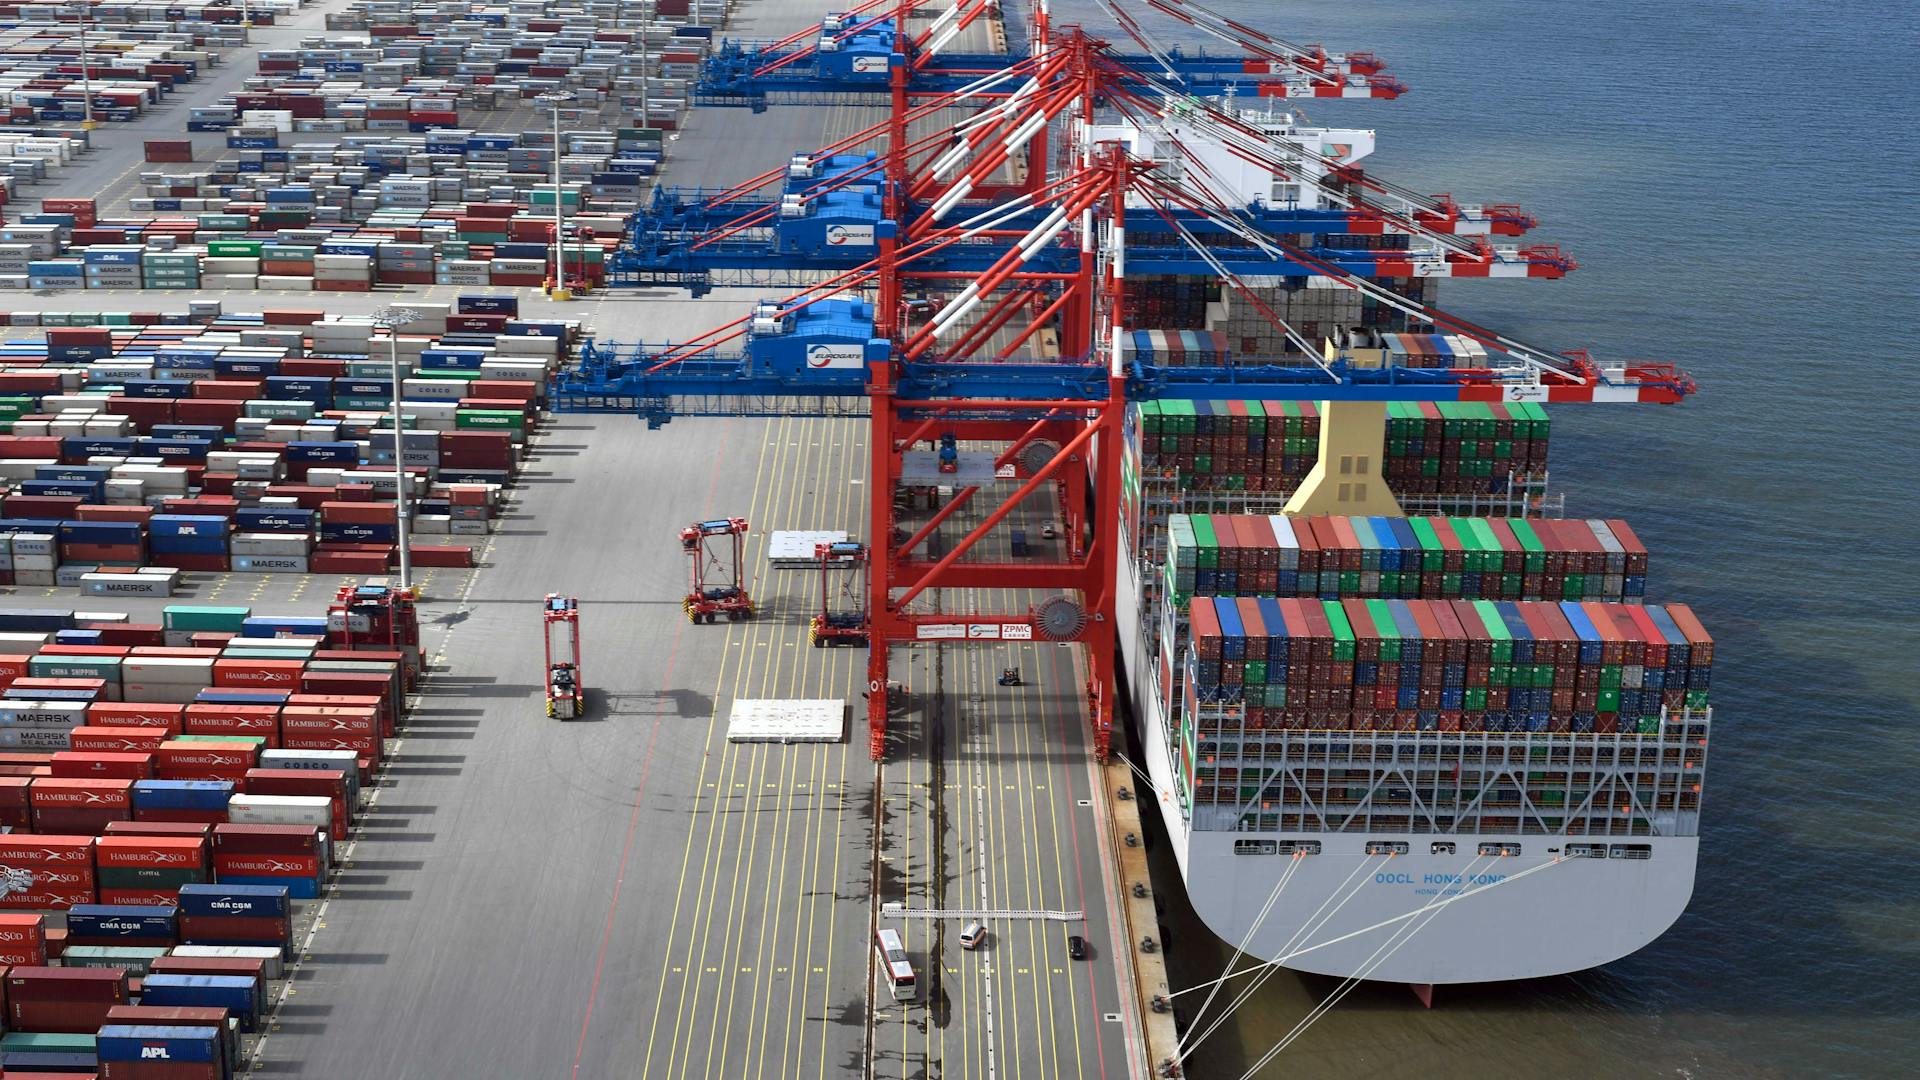
The same swimming happens to container terminals: the amount of data we can collect and store during each handling has never been so wide and reliable as today.
The latest digital Technologies enables us to measure process timestamps, delays, units, location, actors of each end-to-end processes and all these figures can produce relevant key performance indicators (KPI), able to support operators and managers to identify bottlenecks, isolate issues, define best practice and improve efficiency.
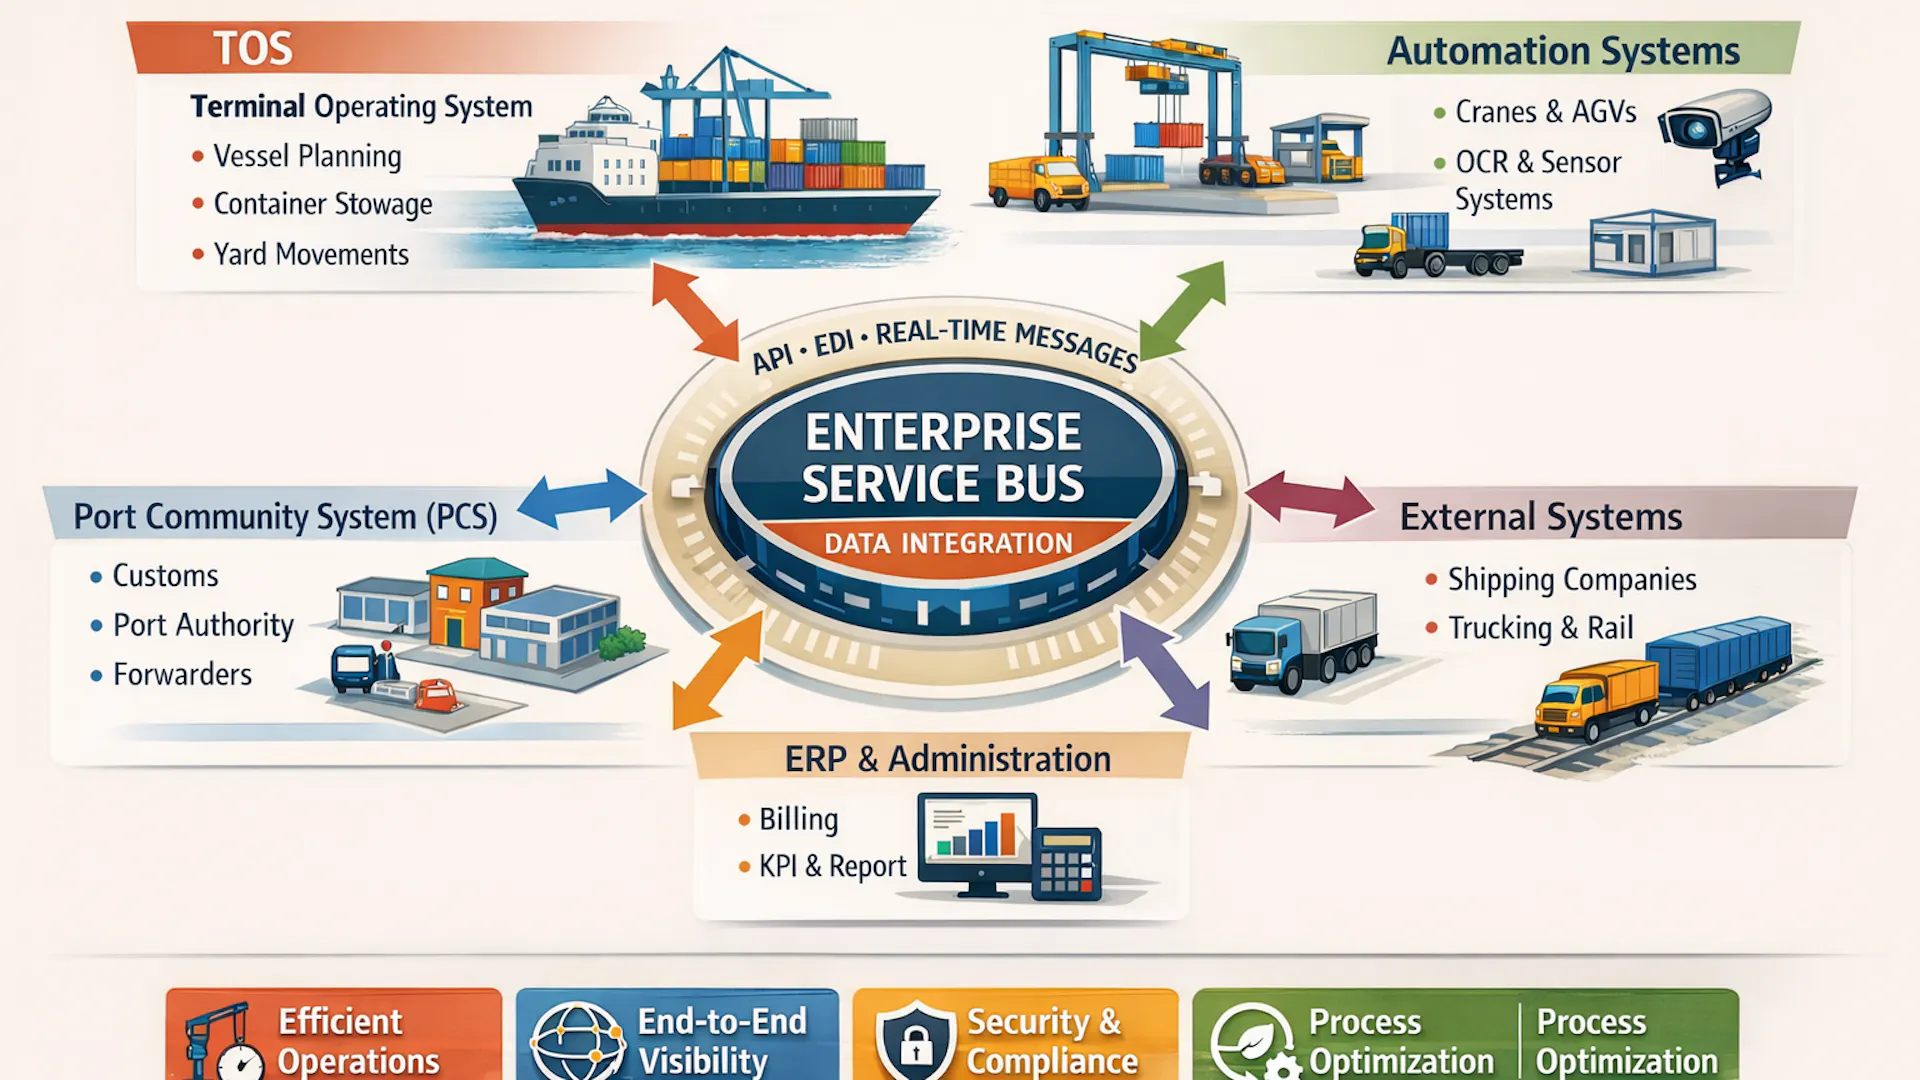
How do we collect information from terminal operations?
- Gate operations organised by stages, with OCR, Tags, badge swipe
- Automated stack inventory and container hand off with DGPS, OCR, RFID
- Geofencing to combine trucks equipment status and positions, to trigger events
- Use of mobile devices on board container handling equipment and by tally clerks
- E-Seals on container (IoT)
- Remote reefer monitoring
- Remote crane diagnostics
- TVCC with motion detection
- Scanners
- And more
All above reaches its edge in case of equipment automation (ASC, QC, AutoRTG, AGV, AutoStrad), where each instruction and movement of each equipment is managed and logged by software.
The Purloined Letter
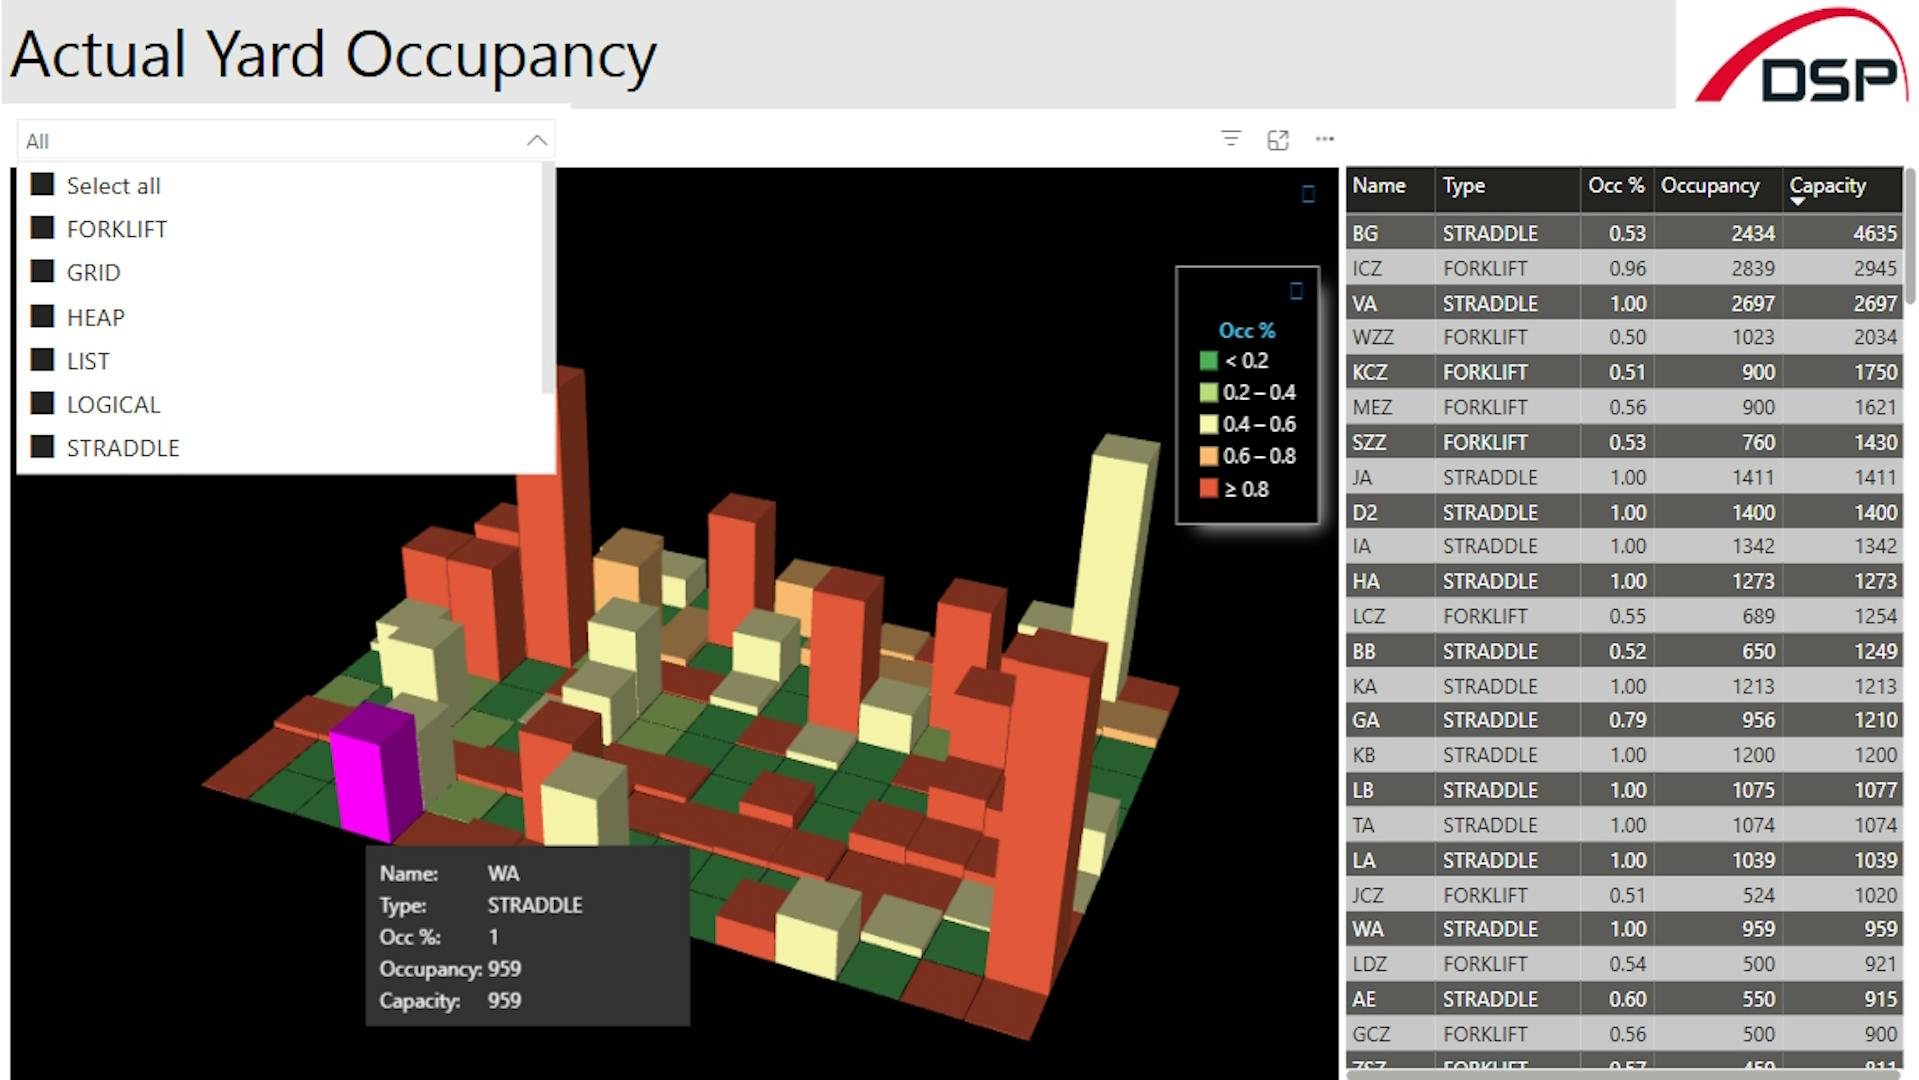
The question is no longer if we can have access to the data but which data do we really need and how we want to use it? To answer those questions, it is important we set our objectives in advance, what we want to achieve and at that point organise and structure data accordingly.
With data being available for free on our systems, the temptation to measure everything and include as many KPI’s as possible on a live dashboard is high, but it may represent a risk as well.
With “The Purloined Letter”, famous short story by Edgard Allan Poe, the author tells us that the thief would not hide the stolen letter in elaborate hiding places but rather leave it in plain sight, as the detectives would have thought of the most complex and original hiding places and do not even look at what is in front of them.
When we are overrun by data, the actual root of an inefficiency might be hidden by data themselves and sometimes simple solutions are just in front of our eyes.
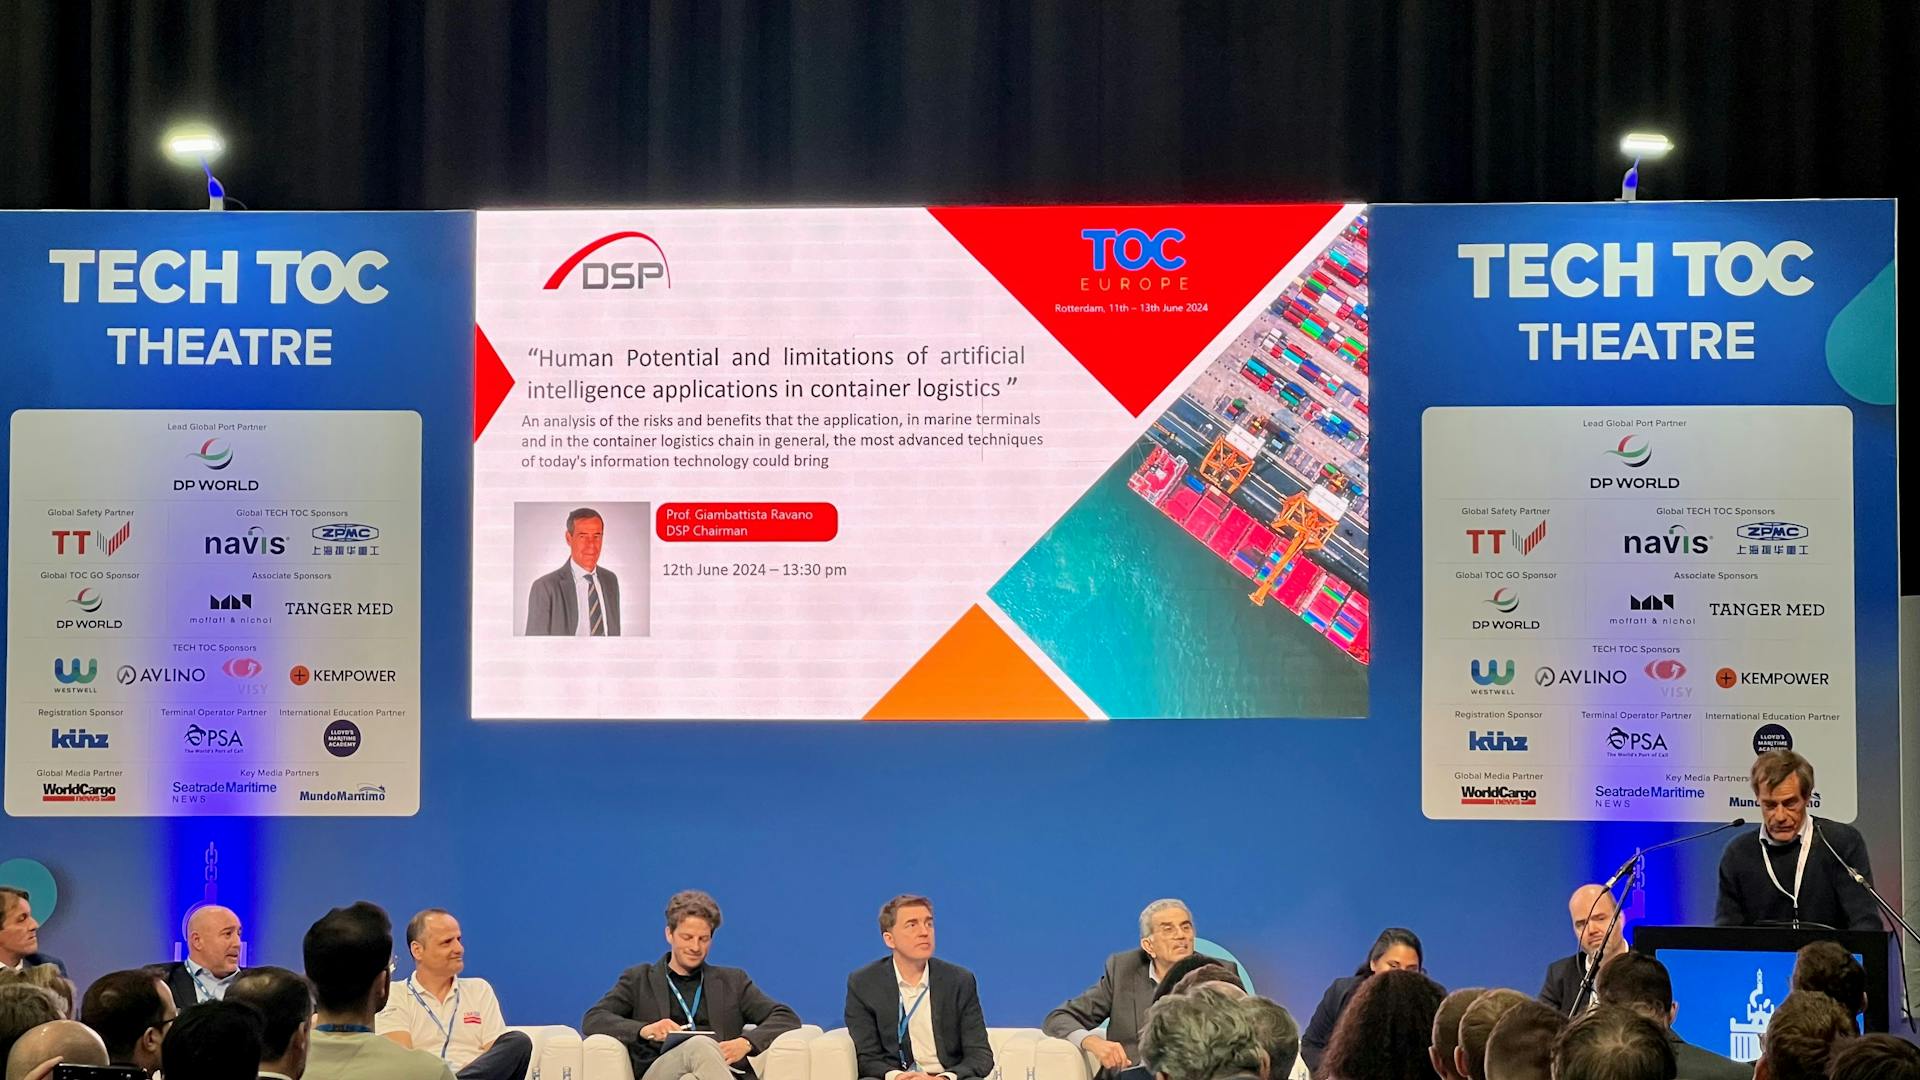
Experience cannot be totally replaced by numbers and Artificial Intelligence, while Machine Learning is still to come in the container terminal industry.
Optimisation is based on algorithms and decisional matrix, which are modelled or configured to work with predetermined targets, under predetermined conditions. If anything goes wrong in the model we have defined, in the software or in the equipment design, we cannot expect that the system would heal itself without any external intervention.
But, not only malfunctions are guilty for process inefficiency: exceptions are not exceptional and proper handling of non-standard cases is a key factor for success. Exceptions can be generated by the process itself, like an unexpected shift on board for vessel convenience or by human “error” in the designed process, like a door not closed, a truck wrongly parked, a refuelling not done.
Testing, simulation, use cases for exceptions handling and finally the observation of reality are still key factors to determine and to achieve the expected result. I would be worried if a fully or semi-automated terminal would not have any camera system to let an expert human eye oversee the quality of the process and drive the data mining to the gold standard: address the analysis where we perceive there is stress.
The Terminal business Ecosystem
Handling boxes is not only a matter of productivity: there are commercial and financial implications that shall be part of a high-level strategy to be turned into drivers for execution managers.
The target productivity is the combination of Service Level Agreements with the shipping line, the costs and the revenues structure of the Terminal.
It might not be needed to pour in additional effort, for example adding more resources if we are already delivering the expected port stay to the line, but on the contrary it might be the right time to focus on optimisation, achieving same results with less.
The same applies during the negotiation phase: why should we discuss so long on a surcharge percentage for an empty IMO tank if we only receive a dozen units per month of that type? Leave it and look for an additional day on the most profitable scale of storage calculation.
Here data becomes really precious, here a what if simulation is a key factor for success, here the big volume of historical data is meaningful and will return reliable predictions.
Real time profit: Vessel visit as a Project
For all of the above, Live Performance Indicators should not focus on productivity measures only, but should look on the costs needed to obtain such level of service and the actual revenue that terminals will obtain from the delivery of its operations.
With the awareness that every terminal is unique, with its own mix of equipment types, cargo distribution, vessel types, labour relations and commercial agreements, it is possible to obtain a sufficient holistic model of a vessel visit profit and loss in real time, using standard running and operational costs, like:
- Hourly maintenance costs
- resources called on shift (outsourcing and internal)
- Fixed costs
We can monitor each handling (or move) with its tariff taken form the billing system and valorise in real time the progression of vessel operations and support shift managers to make the best tactical choice for the following shifts.
Vessel operation is at the end a stand-alone project and should have its planning, execution, control and completion phase with a plan of resources and a return of investment, the revenue.
There is plenty of room for improvements and adjustments during the execution phase of the project (vessel) and we can react to external events (bad weather), exceptions (breakdown), change of scope (stowage instruction) with re-planning and resource assignment.
Analysing the operational and financial indicators can provide many benefits to terminals as it can eliminate a lot of the guesswork within the organisation, enhance communication among departments while co-ordinating activities and enable terminals to respond quickly to changes of operational conditions.
A Business Intelligence system that includes operational and financial figures may transform data into decision-making material and even support what if analysis for commercial decisions.